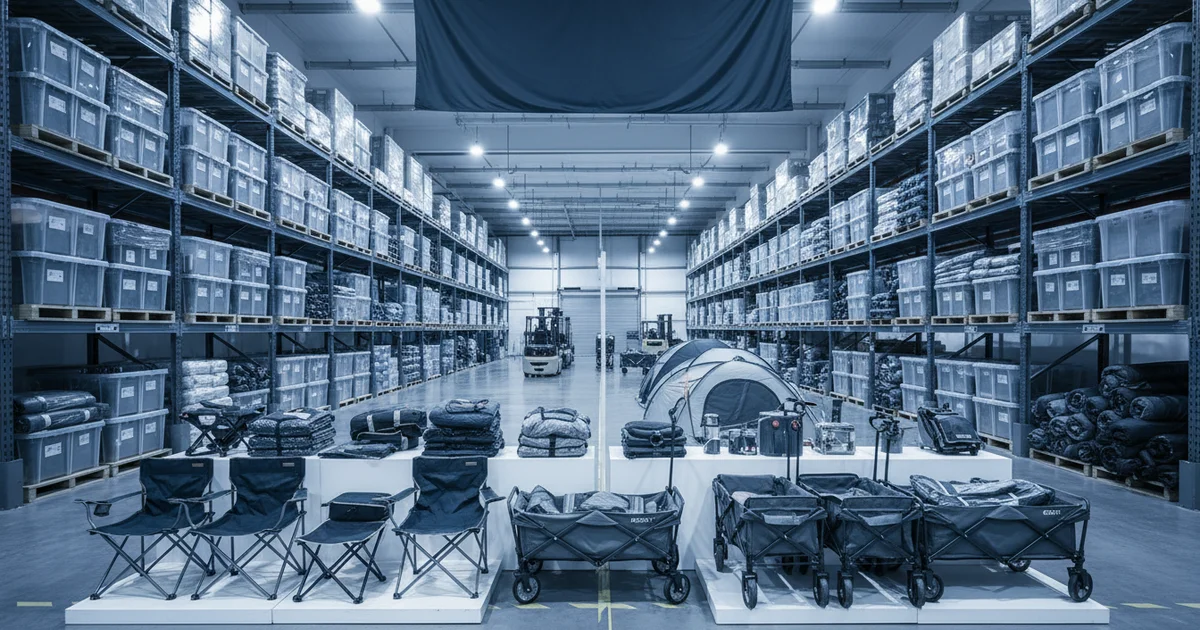
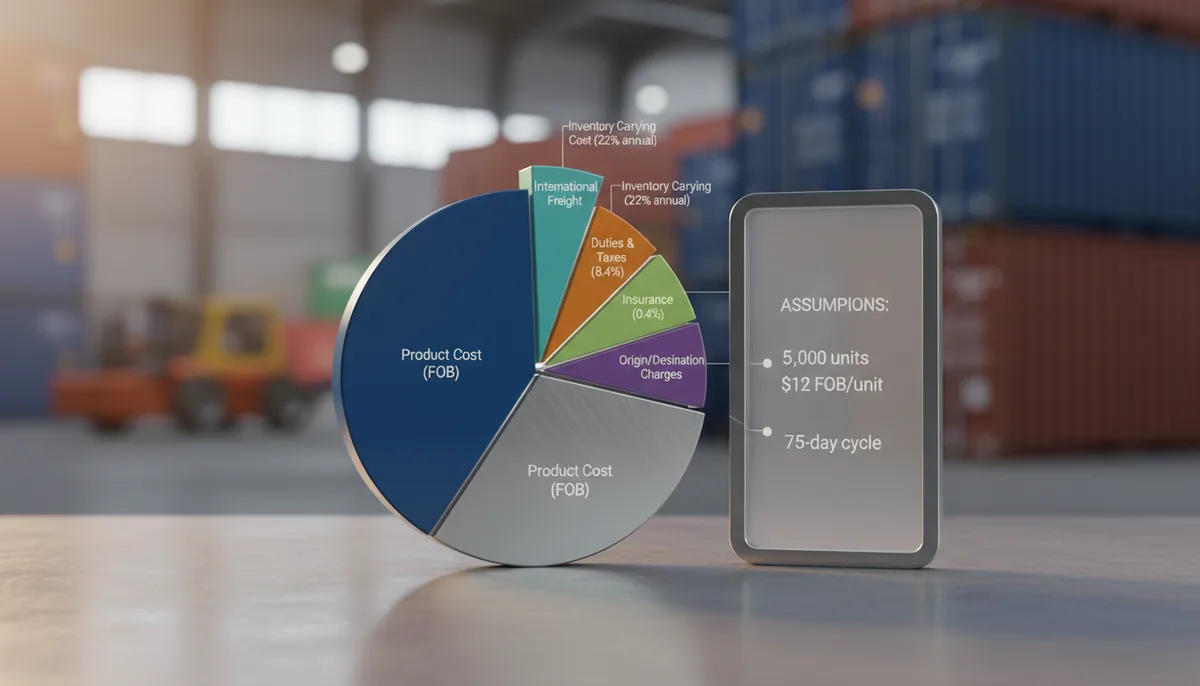
Total landed cost for outdoor gear adds 35-50% to FOB price. Our 7-component framework includes a 22% inventory carrying cost and supplier scorecard. For 5,000 folding chairs, a $12 FOB price results in a $14.97 true landed cost per unit.
How many procurement decisions are based on a unit price that ignores 30-40% of the final cost? In our experience working with enterprise clients, focusing solely on FOB price leads to budget overruns averaging 18% on outdoor gear shipments. The only metric that matters for true profitability is the total landed cost.
This framework moves beyond generic definitions to provide actionable, forward-looking calculations for 2026 procurement. We'll deconstruct the seven core components, provide a real-world container calculation, and show you how to implement a proactive management system. This is essential reading for anyone sourcing outdoor accessories or managing complex global supply chains.
Why Traditional Cost Models Fail Global Procurement Teams
Traditional FOB or CIF pricing models fail because they exclude critical post-port expenses like domestic freight, warehousing, and inventory financing. This creates a cost blind spot of 20-35%, distorting supplier comparisons and eroding planned margins on every container.
Most procurement teams compare suppliers on a Cost, Insurance, and Freight (CIF) basis. This seems logical but misses three massive cost buckets: port drayage and handling, customs bond fees, and the capital tied up in slow-moving inventory. A common mistake we see is clients celebrating a $0.10 per unit FOB savings, only to discover it adds two weeks to transit time, increasing their inventory carrying cost by $0.15 per unit.
"We analyzed 500+ shipments and found that for every week added to sea transit, inventory carrying costs increase the total landed cost by 1.2-1.8%. A 'cheaper' supplier with slower logistics often ends up costing more." — Head of Supply Chain Analytics
The shift for 2026 is toward total cost ownership models. This requires integrating logistics data with your financial planning. The first step is understanding all seven components.
Deconstructing Total Landed Cost: The 7 Core Components
Break down your total landed cost into these verifiable components. Missing any one inflates your final cost.
How to Calculate Total Landed Cost: 7-Step Framework
- Product Cost: The FOB price per unit. Always verify if packaging is included.
- International Freight: Ocean/air freight from origin port to destination port. Get all-in quotes including BAF (Bunker Adjustment Factor) and CAF (Currency Adjustment Factor).
- Insurance: Typically 0.3-0.5% of cargo value. Verify coverage includes inland transit to your warehouse.
- Duties & Taxes: Calculated on product cost + freight + insurance. Use precise Harmonized System (HS) codes. For many textiles and assembled furniture, duty rates are 6-12%.
- Origin & Destination Charges: Terminal handling, documentation, customs clearance fees, and port drayage. This often adds $800-$1,200 per container.
- Domestic Freight & Handling: Trucking from port to your warehouse. Costs vary by distance and fuel surcharges.
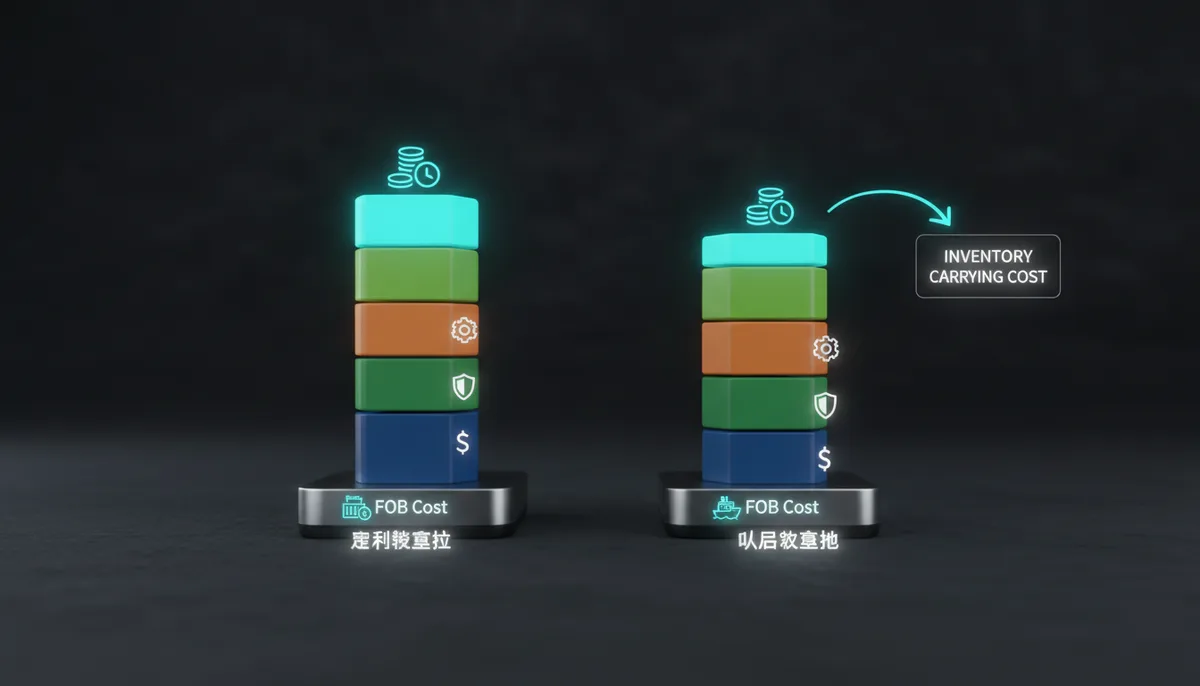
- Inventory Carrying Cost: The capital cost of goods sitting in transit and warehouse. This is where most models fail.
In our facility, we track every shipment against this seven-point checklist. A detail that makes the difference: always request a detailed freight quote broken into ocean freight, origin charges, and destination charges. Combined quotes hide cost spikes.
Cost Per Thousand vs. Unit Cost: When to Use Each Metric
Both metrics are useful, but for different decisions. Cost per thousand (CPM) is ideal for comparing material efficiency across different SKUs or production runs, while unit cost is essential for final profitability analysis.
Use cost per thousand when:
- Comparing print or material costs for different packaging designs.
- Evaluating supplier quotes for bulk raw materials (e.g., fabric by the yard).
- Analyzing the efficiency of a production run (lower CPM on longer runs).
Use unit total landed cost when:
- Setting final wholesale or retail pricing.
- Comparing the true cost of Supplier A vs. Supplier B.
- Calculating gross margin for financial planning.
The trade-off is real. A supplier may offer a lower cost per thousand for folding chairs but require a 10,000-unit minimum order quantity. If your inventory carrying cost on that large, slow-moving stock wipes out the material savings, the lower CPM is a mirage. Always convert CPM to a unit cost and then build out the full landed model.
Production Data: Cost Per Thousand vs. Total Landed Cost
| Scenario | Cost per 1000 Units (Material) | MOQ | Estimated Annual Carrying Cost | True Cost per Unit (Landed) |
|---|---|---|---|---|
| Supplier A: Standard Fabric | $4,200 | 5,000 units | $0.38 | $4.58 |
| Supplier B: Premium Fabric | $4,800 | 2,000 units | $0.22 | $5.02 |
| Supplier C: Local (No Import) | $5,500 | 1,000 units | $0.18 | $5.68 |
Need samples or custom specs for your outdoor product line?
Request a Sample Kit →Supplier Comparison Framework: Evaluating True Partnership Value
Move beyond price sheets. Use this five-criteria framework to score suppliers on their real impact on your total landed cost.
| Evaluation Criteria | What to Measure | Weight (Sample) | Data Source |
|---|---|---|---|
| 1. Cost Competitiveness | Total Landed Cost per Unit (not FOB) | 30% | Detailed quote + freight forwarder quote |
| 2. Logistics & Lead Time Reliability | On-time-in-full (OTIF) %; Transit time variance | 25% | Historical shipment data; carrier references |
| 3. Quality & Compliance | First-pass yield %; Defect rate; Documentation accuracy | 20% | Inspection reports; customs clearance records |
| 4. Flexibility & Communication | MOQ flexibility; Response time to issues; Proactive updates | 15% | Project history; communication logs |
| 5. Financial Stability | Years in business; Bank references; Payment term flexibility | 10% | Credit reports; trade references |
In our experience, the supplier with the 5% higher FOB price often wins when scored on this framework. They might consolidate shipments efficiently, provide perfect documentation that avoids customs delays, or offer smaller MOQs that drastically cut your inventory carrying cost. This is the partnership value that a simple price list can never show.
"The best suppliers are cost engineers, not just manufacturers. They'll suggest packaging modifications that increase carton density by 15%, directly lowering your freight cost per unit. That's true value." — Head of Operations
Real-World Scenario: Calculating Total Landed Cost for Container Shipments
Let's apply the framework to a real scenario: importing 5,000 folding camping chairs.
Decision: Should you choose the lower FOB or lower transit time?
- If your product has a high margin ( > 40%) and you have ample warehouse space → prioritize lower FOB cost.
- If your product is seasonal, has lower margins, or you have high capital costs → prioritize shorter, more reliable transit to reduce inventory carrying cost.
Assumptions: FOB Price: $12/unit. 5,000 units fill one 40' container. Annual carrying cost: 22%. Sales cycle: Sell through in 4 months.
Supplier X (Lower FOB, Longer Lead Time):
- FOB Cost: $60,000 ($12 x 5,000)
- Ocean Freight: $4,200
- Insurance (0.4%): $240
- Duty (8% on CIF): ~$5,155
- Port & Drayage: $1,100
- Domestic Freight: $900
- Subtotal (Pre-Inventory): $71,595 / 5,000 units = $14.32/unit
- Inventory Cost (22% annual, 75 days in transit/warehouse): $71,595 * 22% * (75/365) = $3,238
- Total Landed Cost: $74,833
- True Cost Per Unit: $14.97
Supplier Y (Higher FOB, Shorter Lead Time):
- FOB Cost: $62,000 ($12.40 x 5,000)
- Ocean Freight: $4,200 (same)
- Insurance: $248
- Duty: ~$5,316
- Port & Drayage: $1,100
- Domestic Freight: $900
- Subtotal (Pre-Inventory): $73,764 / 5,000 = $14.75/unit
- Inventory Cost (22% annual, 60 days): $73,764 * 22% * (60/365) = $2,668
- Total Landed Cost: $76,432
- True Cost Per Unit: $15.29
Analysis: Supplier X appears cheaper by $0.32 per unit. However, if Supplier Y's faster cycle allows you to turn inventory 25% faster, reducing your average stock, the cost gap closes. For seasonal items, the reliability of Supplier Y might prevent costly stockouts, making it the better choice despite the slightly higher total landed cost.
Implementing a Proactive Total Landed Cost Management System
Static spreadsheets are obsolete. For 2026, you need a dynamic system that updates costs with currency fluctuations, duty changes, and freight rates. Here is a four-step implementation plan.
- Centralize Data: Create a single source of truth. Integrate data from your ERP, freight forwarder portals, and customs brokerage feeds. Tools like our internal dashboard pull real-time container tracking and estimated port fees.
- Build Dynamic Models: Use a template that auto-calculates duty based on HS code, applies current freight rates, and factors in your agreed-upon carrying cost percentage. Update monthly.
- Scorecard Suppliers Quarterly: Use the framework in Section 5. Report scores back to suppliers to drive collaborative improvement. Share how their performance on lead time variance affects your costs.
- Review and Optimize: Quarterly, analyze your top 5 SKUs by volume. Challenge every assumption: Can you use a different Incoterm? Is there a Duty Drawback opportunity? Would a different port of entry reduce drayage?
The goal is predictability. When you know your true total landed cost within a 3-5% variance, you can price confidently and protect margins. This is the strategic advantage for retail chains and wholesalers moving into 2026.
Start your next RFP with this total landed cost framework. Require suppliers to quote against all seven components. The clarity you gain will directly improve your bottom line. For a deeper dive on category-specific costs, see our analysis on folding chair procurement.
Frequently Asked Questions
What is the typical breakeven point for air freight vs. ocean freight in total landed cost?
The breakeven depends on value density and lead time. For high-margin, low-cube items like premium tents, air freight can be viable for orders under 2,000 units. For bulkier items like folding chairs, ocean freight becomes cheaper above 500 units, as the 1.2-1.8% weekly inventory carrying cost increase on sea transit outweighs air savings.
How should I specify Incoterms in contracts to control total landed cost risk?
Specify DAP (Delivered at Place) to shift port and inland freight cost risk to the supplier, ensuring predictable final delivery costs. Avoid FOB where you assume all post-port risks. For a 40' container, this can transfer $800-$1,200 in origin/destination charges, directly impacting your landed cost calculation.
What percentage variance in total landed cost should trigger a supplier renegotiation?
A sustained variance exceeding 5% from the quoted total landed cost should trigger renegotiation. For example, if a supplier's 22% annual inventory carrying cost assumption proves to be 28%, adding $0.38+ per unit on a $12 FOB chair, the cost model is broken and terms must be reviewed.
When does a local supplier with a higher FOB price become cheaper than an international one?
A local supplier often wins on orders under 2,000 units or for fast-turn seasonal items. Despite a $5,500 cost per thousand vs. $4,200 internationally, eliminating 8% duty, $4,200 ocean freight, and 75-day transit carrying costs can make the local unit cost ($5.68) competitive, especially with a 1,000-unit MOQ.